Mapping Waterways: Turning Open Data into Actionable Insight for Aquaculture
 Understanding waterways is fundamental to sustainable aquaculture, environmental management, and the wider BlueEconomy. From site selection and biosecurity planning to environmental monitoring and regulatory engagement, access to clear, spatially coherent waterway information is essential—yet often fragmented across multiple sources.
At KAMAHU, we’ve been exploring how open geospatial data and modern mapping techniques can make waterways easier to visualise and more useful for industry professionals. This work began as a small creative side-project: the code behind Mapping Waterways was originally designed for KAMAHU’s 2026 greeting card, with the aim of visually expressing the interconnected nature of rivers, catchments, and coastal waters across Europe.
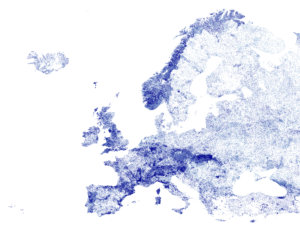
What started as a visual experiment quickly revealed broader relevance. By combining openly available hydrological datasets with lightweight web technologies, raw geographic data can be transformed into a dense, intuitive map that reveals how inland freshwater systems connect directly to estuaries, fjords, and marine environments.
Interpreting Waterway Density and Hydrological Patterns
The visual density shown in the map is not random or stylistic; it is a direct expression of the underlying hydrological
data and how it is rendered.
Norway appears far more densely covered than Sweden primarily due to differences in topography, climate, and drainage structure. Norway’s mountainous terrain, high precipitation, and glacially shaped landscapes produce an exceptionally dense and finely branched river and stream network. Steep elevation gradients generate a large number of short, fast-flowing watercourses that drain rapidly from uplands to the coast.
Sweden, by contrast, is characterised by a lower-relief landscape and a hydrological system dominated by fewer, larger river basins and extensive lake networks. While Sweden contains significant freshwater resources, much of this water is stored within lakes and broad catchments rather than expressed as a tightly branched stream network, resulting in lower visual density.
The contrast is especially pronounced along Norway’s coastline, where thousands of small coastal catchments discharge directly into fjords and nearshore waters. These short hydrological pathways create a highly textured pattern that reflects the close coupling between land, freshwater, and marine systems.
Technically, the map emphasises drainage density and network connectivity, not river size or discharge. Small headwater streams are treated with the same visual importance as major rivers, revealing the full structure of the hydrological network rather than a simplified cartographic view.
How This Relates to European Watershed Maps
At first glance, this representation may appear incompatible with more familiar European watershed maps, which show broad drainage divides separating major basins flowing to different seas. In reality, the two views are fully compatible—they simply operate at different scales and answer different questions.
Watershed maps focus on hydrological divides: conceptual boundary lines defined by elevation that determine where water ultimately drains. They describe basin structure but do not show how water moves within those basins.
By contrast, Mapping Waterways shows the actual flow networks inside those boundaries. It reveals the fine-scale pathways through which water, nutrients, and environmental pressures travel across the landscape before reaching coastal and marine environments.
Rather than being contradictory, the two representations are complementary:
- Watershed maps explain which basin an area belongs to.
- Dense waterway maps explain how water actually moves within that basin.
Together, they provide a more complete understanding of freshwater–marine connectivity.
Relevance for Aquaculture and the Blue Economy
For aquaculture, this system-level perspective is particularly valuable. Coastal conditions are often influenced by numerous small upstream freshwater inputs rather than a single dominant river. Understanding these connections supports better site planning, risk assessment, environmental monitoring, and dialogue with regulators and stakeholders.
By improving visibility of hydrological context, tools like this help bridge the gap between inland processes and marine operations—an essential consideration for sustainable growth within the Blue Economy.
All data sources and code used for Mapping Waterways are openly documented, allowing others to adapt or build upon the approach for different regions or applications.
About KAMAHU
KAMAHU designed the first SaaS for fish farm management in 2012. We work as well at the intersection of environmental data, mapping, and the marine environment. We help organisations turn complex spatial information into clear, practical tools that support sustainability, innovation, and better decision-making across aquaculture and the wider blue sector.
Explore Mapping Waterways here:
👉 https://www.kamahu.com/waterways-mapping/